|
|
- DIANA microT
- DIANA Hexamer
- DIANA Pathways
DIANA microT-3.0
Diana microT is an algorithm for the prediction of miRNA target genes.
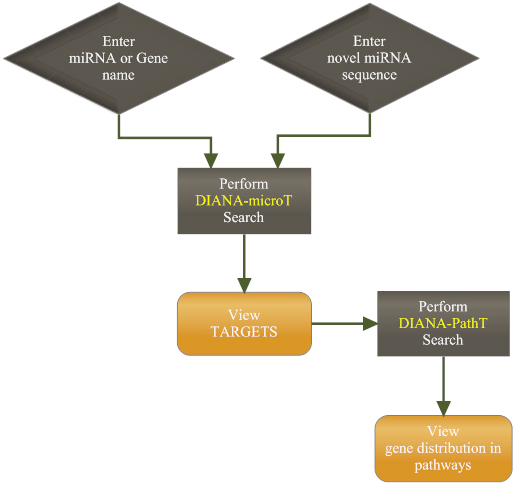
The flowchart below shows the two ways of using it: One is by entering the name of miRNA or the name of a gene whereas the other way is to provide a new miRNA sequence.
Providing a known miRNA name or gene

In the search field the user may choose to provide either a gene name (preferably using the ensembl ID), a miRNA name, both a miRNA name and a gene name or certain keywords that might characterize a gene. Additionally multiple miRNAs or genes may be inputed.
By searching for a miRNA the user is directed to the target results page of the requested miRNA. In this page there are many features available which allow access to different information depending on the user's preferences.

Some of the key features in this page are:
- Total 3'UTR score: The final prediction score. The recommended thresholds would be 7.3 (loose) and 19 (strict)
- Ratio: A supplementary score that defines how much the target differentiates from the background. The greater the value the better the target. This attribute must be examined in combination with the ratio diagram provided for each miRNA (for more information see below “Program Description”).
- Binding site score: Defines how much each binding site on the UTR contributes to the overall 3'UTR score.
- Also found in: Information about whether the target is also predicted by other target prediction programs. The important part here is that this column also provides the targets that are experimentally verified ( provided by tarbase: http://tarbase.cslab.ece.ntua.gr/ )
- Kegg pathways: The specific KEGG pathway containing this particular target gene.
Providing a novell miRNA sequence
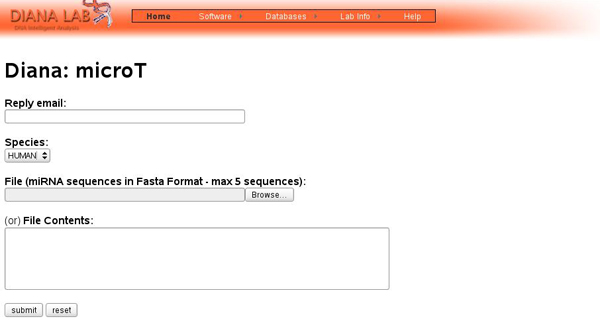
In the above form the user may provide either a file with miRNA sequences in fasta format or paste the contents he wants (only 5 miRNA sequences may be provided each time). An example of a typical file is provided below
>test-miR-1
CATCGTCGTAGCTATCGTCGT
>test-miR-2
CTAGCTGCTGATCGTGCTGAT
When the prediction ends the user will be notified by an email containing a URL where he will be able to view the targets of the miRNAs provided in the same way as if they were precompiled.
Explaining ratio diagram
In general, real miRNAs tend to have more conserved binding sites than shuffled miRNAs. Therefore, it is expected that targets of real miRNAs will achieve greater UTR scores than targets of shuffled miRNAs. Consequently, for each possible UTR score, the degree of differentiation between targets of real and shuffled miRNAs, for this UTR score, may be estimated using the ratio of the total, real versus shuffled miRNA, targets above this score. The greater this ratio, the more the targets of real miRNA differ from the targets of shuffled ones. A graph of the number of predicted targets versus this ratio is shown below.
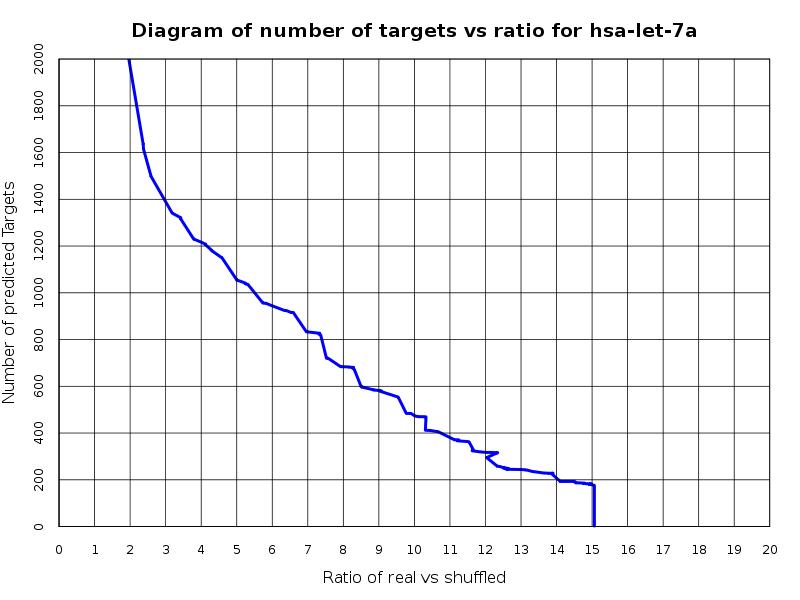
Diagram 1: In this diagram one can see that as the number of predicted targets is reduced (increase of the 3'UTR threshold) we tend to achieve greater ratio values. This means that the fewer the predicted targets the more they differ from the shuffled ones.
In general, the more targets a miRNA has, the better they differ from the background so the greater the ratio they achieve. As a result the above diagram may serve as an indication for the expected number of targets for the miRNA.
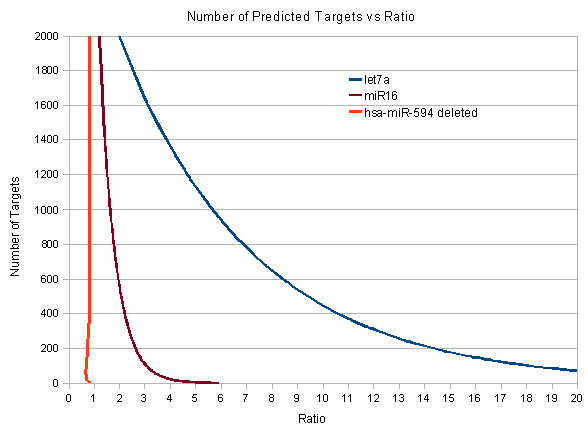
Diagram 2: In this figure one can see the comparison of the ratios for 3 miRNAs. Although the graph can not predict exactly how many targets each miRNA has it denotes that hsa-let-7a seems to have much more targets than hsa-miR-16 because it achieves much greater ratio scores. Moreover it seems that hsa-miR-594 does not differentiate from the set of the shuffled miRNAs, it has a ratio score of around 1 continuously. When this ratio happens it either denotes that the given sequence does not represent a real miRNA or that it is a miRNA that has very few targets. Keep in mind that the sequence used in this prediction of hsa-miR-594 is a miRNA sequence that has been erased from miRBase because it is believed that it is not a real miRNA sequence.
The Hexamers application, helps users identify miRNAs that may be involved in a process of interest.
It is usually used with differential gene expression data (microarray data).
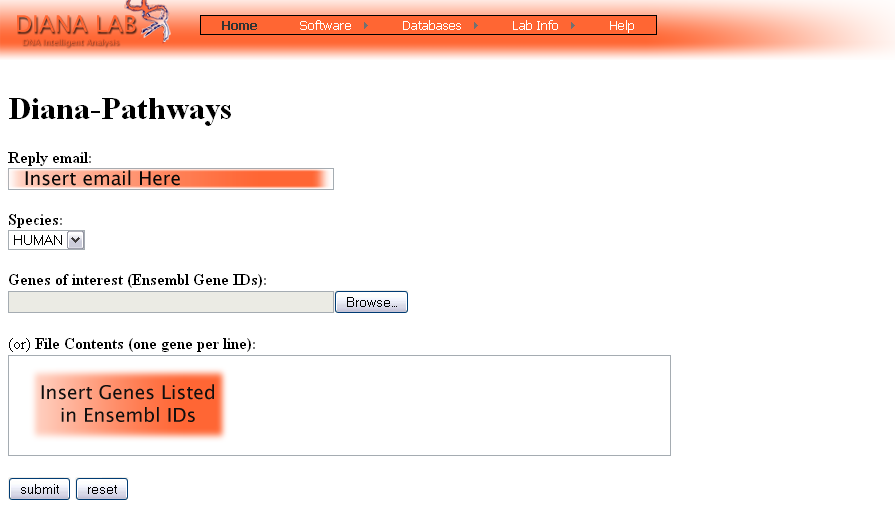
It takes as input: A list of Ensemble Gene IDs (or a file containing these Gene IDs), one on each line. These genes are the genes of interest.
They are usually the genes that show a differential expression between two conditions in a microarray experiment.
An OPTIONAL list of Ensemble Gene IDs (or a file containing these Gene IDs), one on each line.
These genes are the Unchanged genes and are used as a background for the statistical analysis.
If a file is not provided, all the remaining genes in our database will be used.
Species: The species from which the gene names come (currently only Human and Mouse)
Use Conservation (tickbox) : If ticked, then only motifs conserved in both species will be used.
This is maybe a better option if you know that the process you are looking at may be very similar in human and mouse.
Keep Duplicates in Changed List: It is common (especially when gene names are translated from affy codes) that the same gene name ends up in both Changed and Unchanged lists.
The default setting is to ignore these genes from both lists. However it may be of use to just clear the Unchanged (background) list of duplicates while keeping them in the Changed list. Then the box should be ticked.

After Submision of the user's request, the lists provided are checked. Errors that may occur are shown, and provided there are no fatal errors, the request is added to the queue.
It usually takes about 10 minutes to run a request, but depending on the length of the queue it may take longer.
An email will be sent back to the address provided to notify the user of the URL that they can find the results.
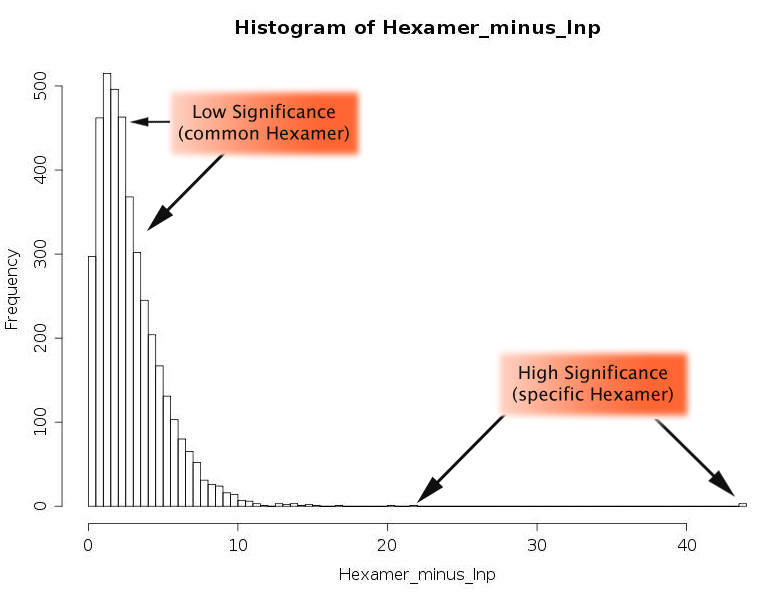
The results are composed of two parts.
The first part is the histogram of the -lnp values of all hexamers. This gives the user an idea of how special a hexamer may be, and where its value lies compared to all the other hexamers.
The second part is a table that shows all hexamers that are connected with the seed region of a miRNA ranked by pvalue,
Hexamer (column 1) = hexamer sequence
Start Position (column 2) = start position of hexamer in miRNA seed region
miRNA (column 3) = miRNA name (link to targets of miRNA on the Changed Genes list – only top 10 miRNAs)
-ln(p value), p value (column 4,5) = pvalue and -ln(pvalue) shows the probability that this hexamer is found more often in the Changed list than in the Unchanged list, as given by a Wilcoxon Rank Sum Test.
Number of genes with hexamer (column 6) = of the Changed genes, how many have at least one of these hexamers in their 3'UTR, and a link to the KEGG analysis of these genes.

The Diana Pathways Software was designed in order to cover the need of a quick and easy
interpretation of the involvement of a series of genes in biological processes
The Software
actually measures the enrichement of genes involved in pathways within a given list.
The list might represent a series of microarray designated
down- or up-regulated genes, a series of miRNA or Transcription Factor targets
or any other user defined list of Human or Mouse genes.
The Software takes as input a list of ensembl IDs of the genes or a list of gene names or refseq ids
that tranforms in EnsIDs and compares it with the KEGG Pathways Database
( KEGG Genes Database Release 46.0+/06-21, Jun 08).
After Submision of the user's request, the list provided is checked. Errors that may occur are shown, and provided there are no fatal errors, the request is added to the queue.
It usually takes about 10 minutes to run a request, but depending on the length of the queue it may take longer.
An email will be sent back to the address provided to notify the user of the URL that they can find the results.
The output of the Software is a Table that illustrates the number and name
of the genes involved in a determined Pathway (in example Cell Cycle...)
and compares it with the expected number of genes, depending on how many genes compose the specific Pathway.
In this way you can have a significance measure of your results,
other than a simple count of involved genes in the determined Pathway.
The results are sorted using the Ratio of the Hits versus the Expected Hits
KEGG Pathway (Column 1): Illustrates the name of the pathway
Gene Name (Column 2): The names of the genes included in the list involved in the specific pathway
Hits (Column 3): Number of genes included in the list involved in the specific pathway
Expected Hits (Column 4): The ratio of the total number of human or mouse genes involved in all pathhways versus the number of genes that compose the specific pathway
Ensembl Gene ID (Column 5): The Ensembl Gene IDs of the genes included in the list involved in the specific pathway
KEGG Pathway ID (Column 6): The identification ID of the Pathway used by the KEGG Database

 |